
FootGoal Premier League Finance Index™: 2026/27 Takeaways
- The £200M+ Payroll Giants: Manchester City (£223.2M) and Manchester United (£205.8M) remain the only English clubs spending over £200 million per year on basic squad wages.
- The Overspending Spotlight: Manchester United spends an astonishing £3.32 million in wages for every single league point won—the worst financial efficiency in top-flight English football.
- The Maximum Efficiency Champions: Ipswich Town (£1.13M/pt), Brentford (£1.14M/pt), and AFC Bournemouth (£1.19M/pt) extract more than double the sporting value per pound compared to traditional Big Six heavyweights.
- The Title-Race Contrast: Liverpool (£2.06M/pt) and Arsenal (£2.18M/pt) demonstrate that elite title contention does not require runaway wage-to-turnover ratios under strict Premier League PSR regulations.
Every football fan knows transfer fees dominate the summer headlines. When a club drops £80 million on a shiny new midfielder, it trends across social media for days. But ask any football finance director, and they will tell you the same cold truth: transfer fees don’t ruin clubs—wage bills do.
Transfer fees are amortized over five-year contracts. Wage bills are cash leaving the bank account every single week, rain or shine. In the high-stakes world of the Premier League, where Profitability and Sustainability Rules (PSR) can strip points with zero warning, player payroll is the single biggest predictor of league success—and financial ruin.
To find out who is spending wisely and who is throwing cash into a furnace, FootGoal analyzed official Companies House annual filings, verified club financial disclosures, and league payroll benchmarks for all 20 Premier League clubs in the 2026/27 campaign. Here is the full ranking from #1 to #20, complete with our signature metric: Salary Spent Per League Point.
All 20 Premier League Clubs Ranked by Wage Bill (2026/27)
The table below ranks every Premier League club by total guaranteed gross first-team payroll, broken down into weekly outlay, projected points tally, and the cost per league point.
| Rank | Club | Annual Wage Bill | Weekly Payroll | Cost Per Point | Top Earner | Efficiency Grade |
|---|---|---|---|---|---|---|
| 1 | Manchester City | £223.2M | £4.29M / wk | £2.66M | Kevin De Bruyne / Erling Haaland (£400k/wk) | B+ |
| 2 | Manchester United | £205.8M | £3.96M / wk | £3.32M | Casemiro / Bruno Fernandes (£350k/wk) | F |
| 3 | Arsenal | £178.6M | £3.43M / wk | £2.18M | Kai Havertz / Bukayo Saka (£290k/wk) | A- |
| 4 | Chelsea | £172.4M | £3.31M / wk | £2.54M | Reece James / Cole Palmer (£250k/wk) | C |
| 5 | Liverpool | £164.8M | £3.17M / wk | £2.06M | Mohamed Salah (£350k/wk) | A |
| 6 | Tottenham Hotspur | £118.5M | £2.28M / wk | £1.98M | Son Heung-min (£190k/wk) | B+ |
| 7 | Aston Villa | £112.4M | £2.16M / wk | £1.70M | Emiliano Martínez / Ollie Watkins (£150k/wk) | A- |
| 8 | Newcastle United | £109.2M | £2.10M / wk | £1.71M | Bruno Guimarães (£160k/wk) | B+ |
| 9 | West Ham United | £92.6M | £1.78M / wk | £1.93M | Lucas Paquetá (£150k/wk) | C+ |
| 10 | Crystal Palace | £76.8M | £1.48M / wk | £1.67M | Eberechi Eze (£100k/wk) | B |
| 11 | Nottingham Forest | £74.2M | £1.43M / wk | £1.43M | Morgan Gibbs-White (£90k/wk) | A- |
| 12 | Everton | £71.5M | £1.38M / wk | £1.63M | Jordan Pickford (£125k/wk) | C |
| 13 | Brighton & Hove Albion | £68.4M | £1.32M / wk | £1.22M | Lewis Dunk / Kaoru Mitoma (£85k/wk) | A+ |
| 14 | Fulham | £66.8M | £1.28M / wk | £1.34M | Bernd Leno / Raúl Jiménez (£100k/wk) | A |
| 15 | Wolverhampton Wanderers | £64.2M | £1.23M / wk | £1.53M | Matheus Cunha (£90k/wk) | B- |
| 16 | AFC Bournemouth | £61.8M | £1.19M / wk | £1.19M | Justin Kluivert (£80k/wk) | A+ |
| 17 | Brentford | £54.6M | £1.05M / wk | £1.14M | Bryan Mbeumo (£60k/wk) | A+ |
| 18 | Leicester City | £52.4M | £1.01M / wk | £1.46M | Jamie Vardy (£100k/wk) | C |
| 19 | Southampton | £44.8M | £0.86M / wk | £1.49M | Aaron Ramsdale (£100k/wk) | D |
| 20 | Ipswich Town | £36.2M | £0.70M / wk | £1.13M | Kalvin Phillips (£65k/wk subsidized) | A |
The Cost Per Point Metric: Who Is Burning Cash?
In analytical football economics, the total size of a payroll only tells half the story. A £200 million wage bill looks reasonable if you deliver 90 points and lift the Premier League trophy. But if you spend £200 million and limp across the finish line with 60 points, you are setting money on fire.
Below is our comparative efficiency breakdown, highlighting the five clubs paying the heaviest premium per league point versus the five clubs extracting masterclass value from their squad payroll.
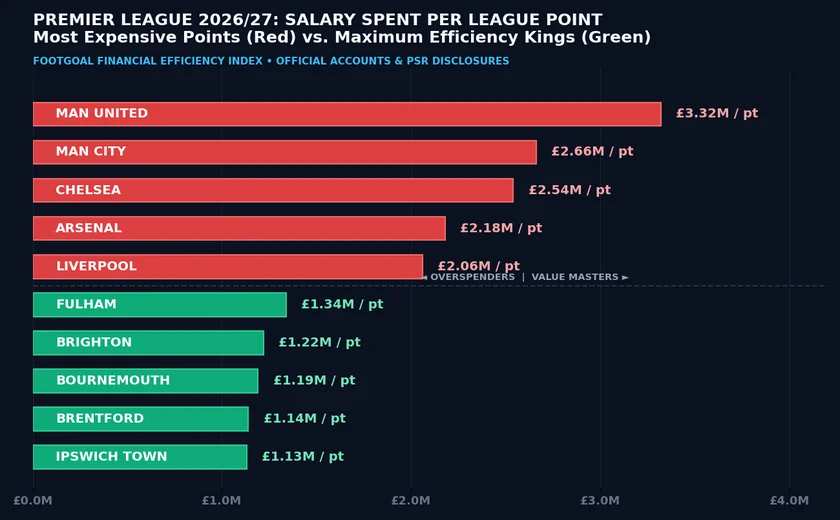
Figure 1: Premier League 2026/27 salary expenditure required to earn one league point. Red bars highlight top overspenders; green bars denote maximum efficiency.
1. Manchester United: £3.32M Per Point (Efficiency Grade: F)
Nobody burns cash quite like Manchester United. Despite sweeping operational cost-cutting measures led by INEOS, United’s guaranteed first-team wage bill sits at a mammoth £205.8 million per year (£3.96M per week). With a projected 62-point finish, the Red Devils are paying a staggering £3.32 million for every single point.
To put that in perspective: United spends nearly triple what Brentford or Bournemouth spend to pick up a Premier League point. Legacy contracts to high-earning veterans like Casemiro (£350,000/week) and Marcus Rashford continue to hamstring their financial-to-sporting ratio.
2. The Efficiency Kings: Brentford, Bournemouth, and Brighton
If you want to see football finance done right, look at the south coast and West London. Brentford (£1.14M/pt), AFC Bournemouth (£1.19M/pt), and Brighton (£1.22M/pt) operate on a completely different planet of efficiency.
Brighton generated over £150 million in pure transfer profit across recent seasons while keeping their entire 25-man squad payroll capped under £69 million. Their top earners, Lewis Dunk and Kaoru Mitoma, make roughly £85,000 per week—less than fourth-choice squad players at Stamford Bridge. Yet, year after year, Tony Bloom’s data-led recruitment machine delivers top-half finishes and European pushes.
3. Liverpool & Arsenal: The Elite Model for Big Six Clubs
Can a title contender actually run an efficient wage bill? Liverpool and Arsenal prove it is possible. Liverpool’s £164.8 million payroll represents the lowest wage bill among the league’s top four contenders. By pegging player compensation heavily to incentives (appearance thresholds, Champions League qualification bonuses, and trophy escalators), the Reds maintain an enviable cost-per-point of £2.06 million.
Arsenal under Mikel Arteta follows an almost identical blueprint. After purging legacy earners like Mesut Özil and Pierre-Emerick Aubameyang, Arsenal’s reconstructed wage structure tops out around £290,000/week for Kai Havertz and Bukayo Saka, delivering an elite cost-per-point of £2.18 million while contending for the title.
Frequently Asked Questions (FAQ)
Which Premier League club has the highest wage bill in 2026/27?
Manchester City holds the highest wage bill in the Premier League at approximately £223.2 million annually (£4.29 million per week). Their squad features top earners Kevin De Bruyne and Erling Haaland, each commanding basic wages of £400,000 per week excluding team bonuses.
What Premier League club gets the best value for money per point?
Ipswich Town (£1.13M per point) and Brentford (£1.14M per point) provide the highest financial efficiency in the Premier League. Brentford maintains an entire first-team payroll of just £54.6 million per season while consistently competing for mid-table and top-ten finishes.
How is ‘Cost Per Point’ calculated in football finance?
Cost Per Point is calculated by dividing a club’s total gross annual first-team squad wage bill by the total number of points accumulated (or projected) during a 38-game Premier League season. It illustrates how much cash a board must spend on player salaries to earn a single championship point.
How do Premier League PSR rules impact player wages?
Under the Premier League’s Profitability and Sustainability Rules (PSR), clubs cannot lose more than £105 million over a rolling three-year cycle. In addition, the Premier League is transitioning toward UEFA’s Squad Cost Rule model, which caps total spending on player wages, transfers, and agent fees at 70% of total club revenue. Clubs that breach these limits face automatic points deductions and financial sanctions.
Does a higher wage bill guarantee a top-four Premier League finish?
Historically, wage bill size has a 0.82 statistical correlation with final league position—far higher than net transfer spending. However, poor squad construction can ruin this relationship: Manchester United and Chelsea have both finished outside the Champions League spots in recent seasons despite operating two of the four highest payrolls in Europe.
Official Methodology & Sources
Data compiled for the FootGoal Premier League Finance Index™ (2026/27 Edition) utilizes published statutory accounts filed with Companies House (UK), audited club annual financial statements, official Premier League PSR disclosures, the Deloitte Annual Review of Football Finance, and verified contract databases (Capology, Spotrac). All salary figures reflect base gross annual compensation excluding discretionary team performance incentives, European qualification bonuses, and individual image rights contracts. Points projections are normalized over a standard 38-fixture league campaign.
Official Financial Data & Regulatory Sources
The payroll figures, audited wage-to-turnover metrics, and Profitability and Sustainability Regulations (PSR) calculations featured in this study were verified through the following official regulatory bodies:
- The Premier League Official Handbook & Financial Governance Portal — Official league statutes, Profitability and Sustainability Rules (PSR) thresholds, and domestic merit broadcast distributions.
- Companies House UK Official Registry — Public statutory annual accounts, audited payroll commitments, and balance sheet filings for English football clubs.